
Map matching solves a fundamental problem with GPS data; Raw GPS data from vehicles or phones is inherently noisy. It zigzags through buildings, jumps across intersections, and disappears in tunnels. For any serious traffic analysis, emission modeling, or routing application, this raw data is unreliable. The solution is map-matching: the process of snapping a sequence of coordinates to the most likely path on a real-world road network.
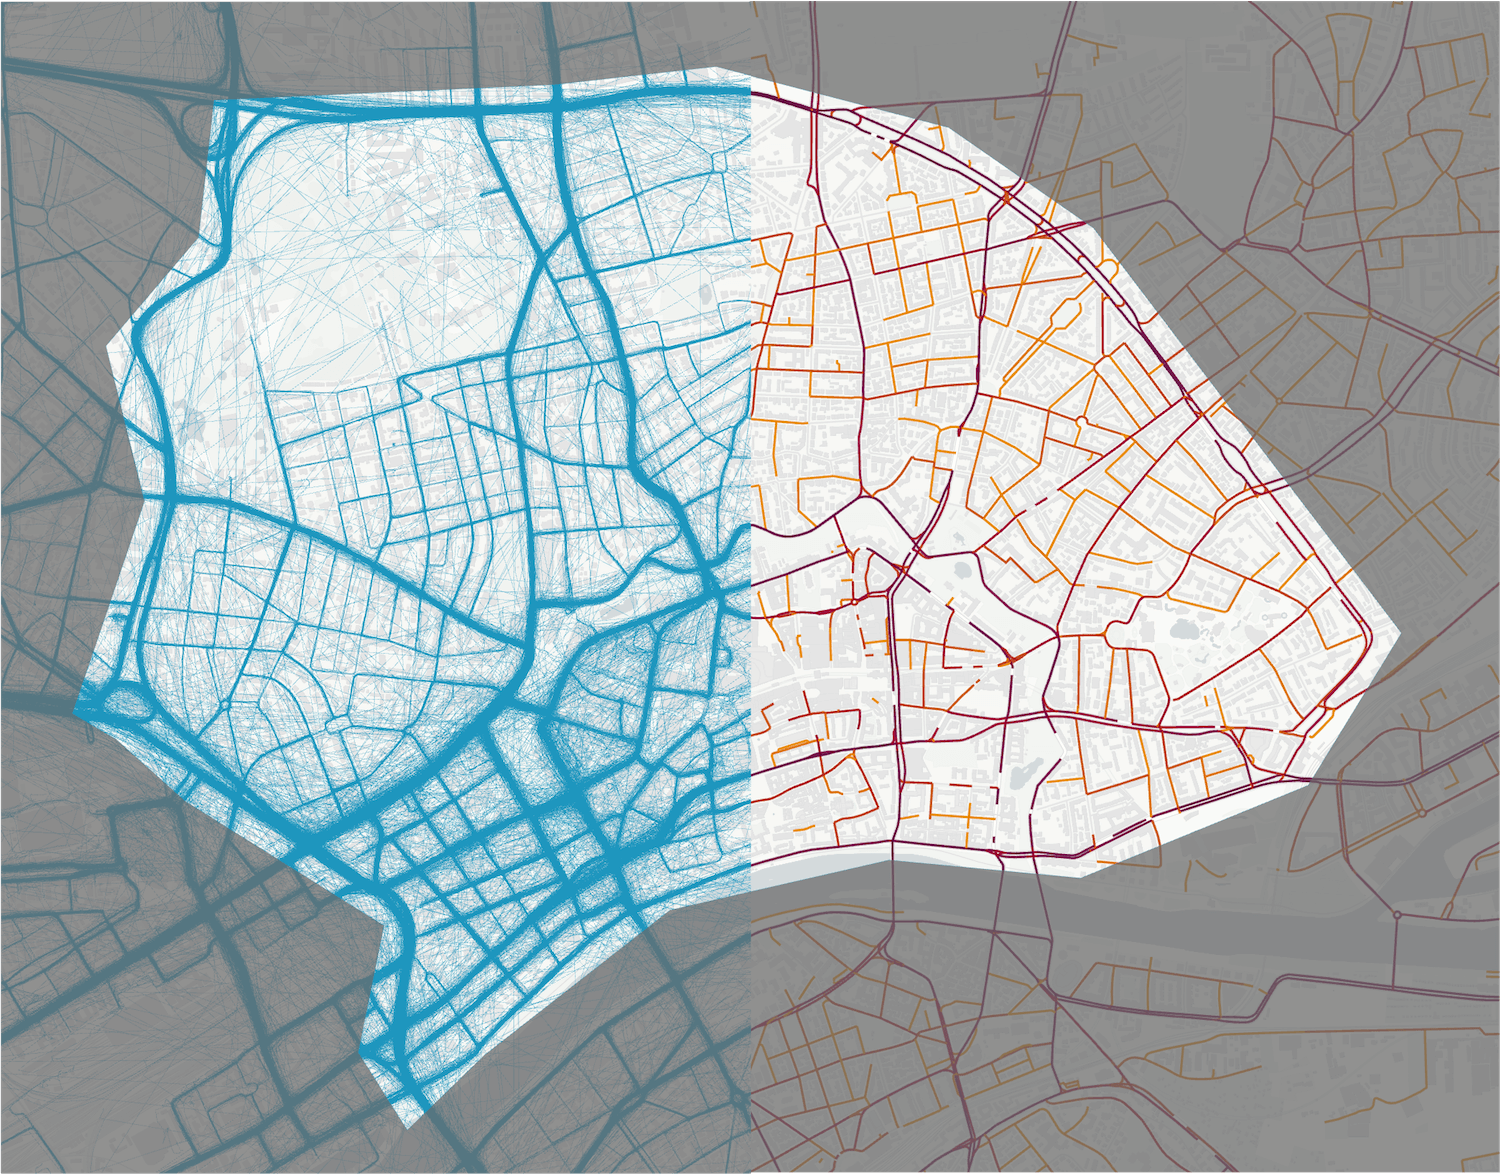
To see the difference before and after map matching of a gps track, check out this interactive map showing a recording of my actual bike commute from the subway station to work. The raw, messy GPS track is in blue, and the clean, map-matched route is in red.
Move the interactive maps with your mouse and see how fuzzy raw points are snapped to road segment after map matching!
Before: Raw GPX Track
After: Map-Matched Route
In this guide, we’ll build a powerful, offline map-matching server using Valhalla and then use the tools in the MapMatching project to process trips and visualize the results.
By the end of this tutorial, you will:
- ✅ Have a fully functional, local Valhalla server running.
- ✅ Know how to batch-process multiple GPX trip files.
- ✅ Be able to visualize and analyze results in an interactive dashboard.
All the code is in the MapMatching GitHub Repository.
You can also try a live map matching demo with a small GPX file right now at mapmatch.streamlit.app!
Part 1: Prerequisites for Map Matching- Gathering Your Tools 🛠️
Before we start, you’ll need two things.
1. Docker
This is the highly recommended way to run Valhalla. It avoids complex dependency issues and ensures a clean, isolated environment. If you don’t have it, install it now.
- Install Docker Desktop (for macOS or Windows)
- Install Docker Engine (for Linux)
2. OpenStreetMap (OSM) Data
Valhalla builds its road network graph from OSM data. This data comes in a compressed .osm.pbf file format. We’ll use a regional extract for this tutorial.
- Go to Geofabrik.de.
- Navigate to Europe -> Germany -> Hessen. (Or your region of choice)
- Download the
hessen-latest.osm.pbffile.
Part 2: The Setup – Getting Everything Ready 🚀
This process involves getting the code, launching the Valhalla server, and setting up the Python environment.
Step 1: Get the Code
First, clone the MapMatching repository and navigate into the directory.
git clone https://github.com/amirbabaei97/MapMatching.git
cd MapMatching
Step 2: Launch Valhalla with Docker
Create a folder named custom_files inside the project directory and place your downloaded hessen-latest.osm.pbf file into it. Then, run the following command in your terminal:
docker run -dt --name valhalla -p 8002:8002 -v $PWD/custom_files:/custom_files ghcr.io/valhalla/valhalla-scripted:latestThis command downloads the official Valhalla image and starts it. On its first run, it will automatically find your .pbf file and build the routing tiles. This can take 5-15 minutes. You can watch the progress with docker logs -f valhalla.
To verify it’s working, open http://localhost:8002/status in your browser. You should see a JSON response confirming the service is running.
Step 3: Set up the Python Environment
Now, let’s prepare the Python tools.
# 1. Create and activate a virtual environment
python3 -m venv .map_matching
source .map_matching/bin/activate

# 2. Install the required libraries
pip install -r requirements.txt

# 3. Create your configuration file
cp .env.sample .env
The .env file holds all the settings for the scripts, like the Valhalla URL and file paths. The default settings should work perfectly with the Docker setup above.
Part 3: Run the Batch Processor ⚙️
The repository includes a powerful script, map_matching.py, that finds all GPX files in the input folder, processes them in parallel, and saves the results.
To run it, simply execute:
python map_matching.pyThe script will:
- Read all
.gpxfiles from thedata/sample_trips/directory (you can change this in the.envfile or simply update its contents with your own.gpxfiles). - Match each trip against the road network using your local Valhalla server.
- Save the clean, matched routes as GeoJSON files in the
data/results/directory. - Show a real-time progress bar in your terminal.
Part 4: Cherry on top – The Interactive Dashboard 📊
This is where you get to see the magic. The project includes an interactive web dashboard built with Streamlit that lets you upload a trip and instantly see the before-and-after comparison.
You can also try a live map matching demo with a small GPX file right now at mapmatch.streamlit.app!
Launch the dashboard with this command:
streamlit run dashboard/app.pyYour browser will open a new tab with the application. Here, you can:
- 📤 Upload any GPX file.
- 🗺️ Compare the raw GPS trace (blue) against the clean, map-matched route (red) on an interactive map.
- 📈 Analyze key metrics like distance, duration, and signal quality.
- 💾 Download the final matched route as a GeoJSON file.
Conclusion & Next Steps
You now have a complete, local map matching pipeline. With the map_matching.py script and the Streamlit dashboard, you can process large datasets for research and immediately visualize the results for analysis and presentation.
- Explore the Code: Dive into the Map Matching GitHub Repository to see how the scripts work.
- Troubleshooting: If you have connection issues, use
docker logs valhallato check the server status. For performance, you can adjust theMAX_WORKERSsetting in your.envfile. - Go Further: Valhalla is more than just a map-matcher. Explore its documentation to see how you can use your server for turn-by-turn routing, generating isochrones (reachability polygons), and more. Happy mapping!

Questions?
If you have any questions or feedback, feel free to reach out at [email protected].